Managing Multiple Solana Validators in an Enterprise Environment
SOL Strategies is an enterprise grade staking provider, managing four of our own Solana validators, in addition to a Solana validator for PENGU. Managing multiple Solana validators can take a lot of effort, especially in a publicly traded, regulated company which also conforms to security standards as set in certifications like ISO 27001 and SOC […]
SOL Strategies is an enterprise grade staking provider, managing four of our own Solana validators, in addition to a Solana validator for PENGU. Managing multiple Solana validators can take a lot of effort, especially in a publicly traded, regulated company which also conforms to security standards as set in certifications like ISO 27001 and SOC 2. Because of this, we have significantly automated our operations, while also continuing to maintain the highest levels of security.
Environment
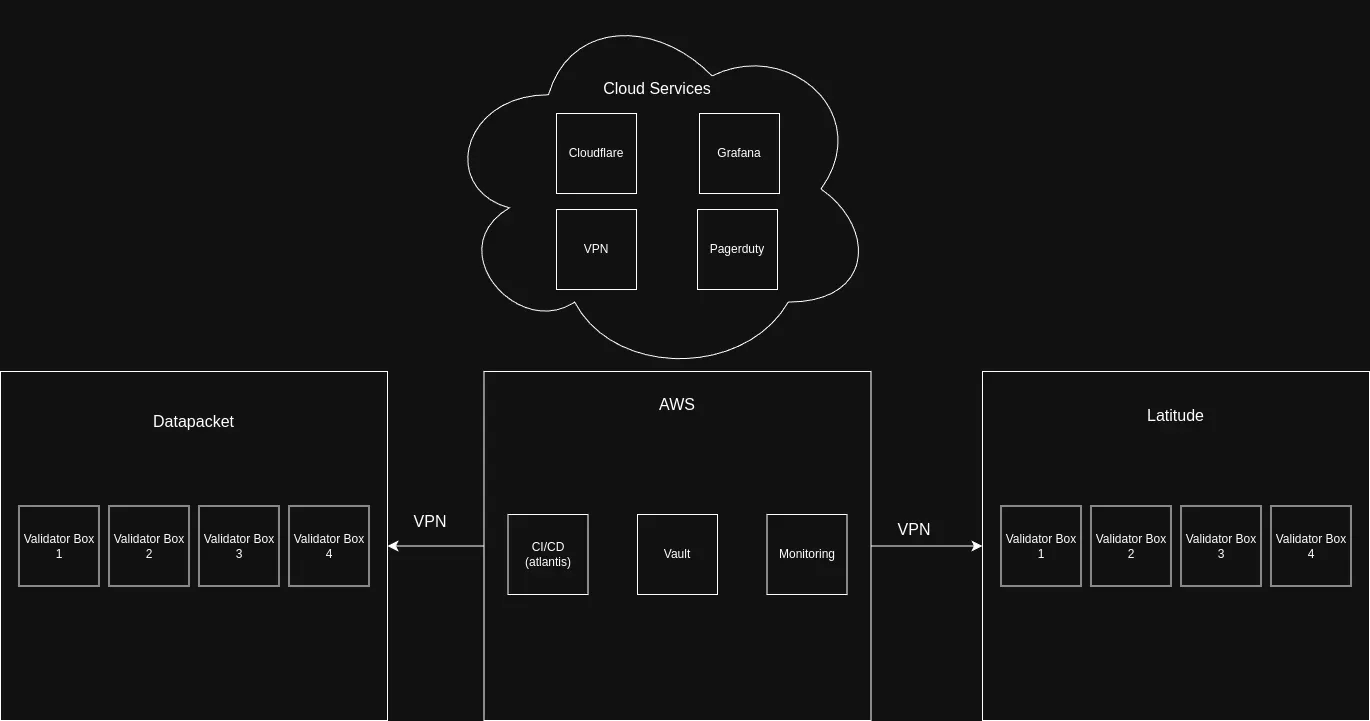
Our environment consists of infrastructure spread across several providers
- AWS: We run a Kubernetes cluster with several key components for automation and security such as Atlantis, Hashicorp Vault, our monitoring stack, and much more.
- Datapacket: Each of our Solana validators has a server inside Datapacket. To conform with ISO 27001, we only work with certified providers.
- Latitude: We also run a server for each of our validators in Latitude, another ISO 27001 certified provider. Each of our validators runs in an active / passive pair. This is done for disaster recovery & business continuity purposes. In the event that a vendor goes down, we have an active validator running as a “hot spare” at a different provider which we can failover to within minutes.
- VPN: We run a VPN where a box or pod in one environment can talk to another box in a different environment, all over private routes, and protected by strict ACLs. As an example, our CI/CD system runs in AWS and deploys a validator in Datapacket and Latitude all directly over private routes.
- Monitoring: We leverage Grafana, Solana Watchtower, and PagerDuty for alerting. In the event of an outage, we have a global 24/7 on-call team with multiple engineers in APAC and North America.
Infrastructure As Code
Every piece of infrastucture we have at SOL Strategies is defined in IaaC (Infrastructure as Code). This provides several key benefits for us:
- Automation: By having everything in code, we can automate deployments. This saves a significant amount of developer time for us.
- Repeatability: Since all of our infrastructure is defined in code, we know that when we deploy something, there will be no steps missed, which is very common in companies that rely on manual deployments.
- Disaster Recovery: In the event of a total disaster like a server completely dying or a hack, we can deploy all our infrastructure again on brand new hardware in a very short amount of time.
- Auditability: By having everything tracked in git, we can give our ISO 27001 / SOC 2 auditors access to source code to see what changes happened and when.
- Security: We have static analysis tools that scan all of our infrastructure code to make sure we are following best practices and are aware of any CVEs.
We use 2 main languages for IaaC:
- Ansible: This is used to deploy our Solana validators.
- Terraform: This is used to deploy all of our other infrastructure such as our AWS infrasturucture, k8s deployments, dns records, vpn config, all of our servers at Latitude, and much more.
All of our deployments are automated by Atlantis, an open source Terraform automation tool we self-host.
Setting up a Solana Validator
To spin up a Solana validator we simply just add a new validator into our inventory.
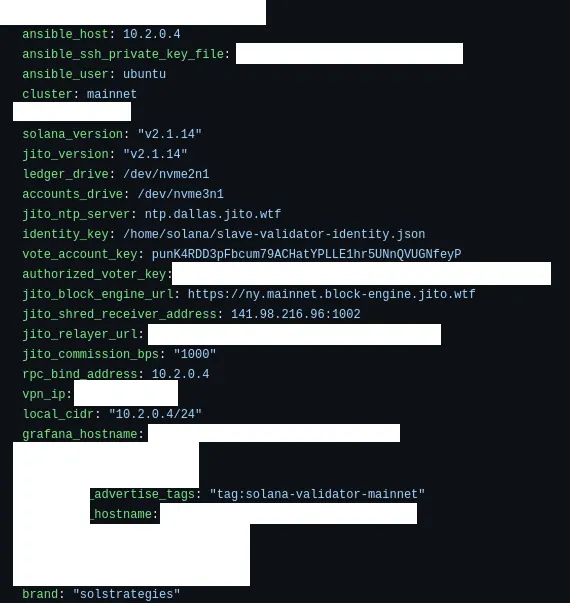
When our Ansible playbooks run, they provision everything. This includes:
- Making sure all packages are updated
- Configuring the operating system
- Ensuring the machine is rebooted in case the operating system says it needs to be rebooted
- Installing all our monitoring software
- Ensuring the device is connected to our VPN
- Configuring all of our performance optimizations
- Configuring the validator (our automation supports the agave client, jito, and firedancer)
- Configuring the firewall
- Much more
Every time our playbook runs, it runs every step over again. This ensures that even in the event something got deleted, our automation adds it back.
Once this is done, a PR is submitted where Atlantis diffs the changes.
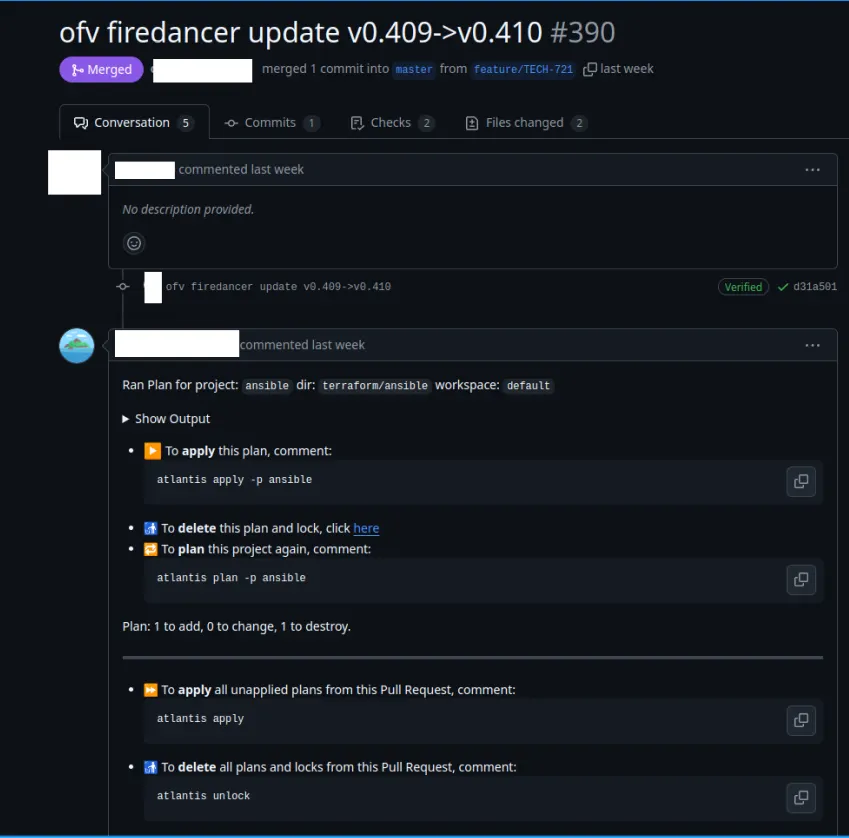
From there, a developer simply has to comment atlantis apply and the entire pipeline runs either spinning up a new validator, or upgrading one.
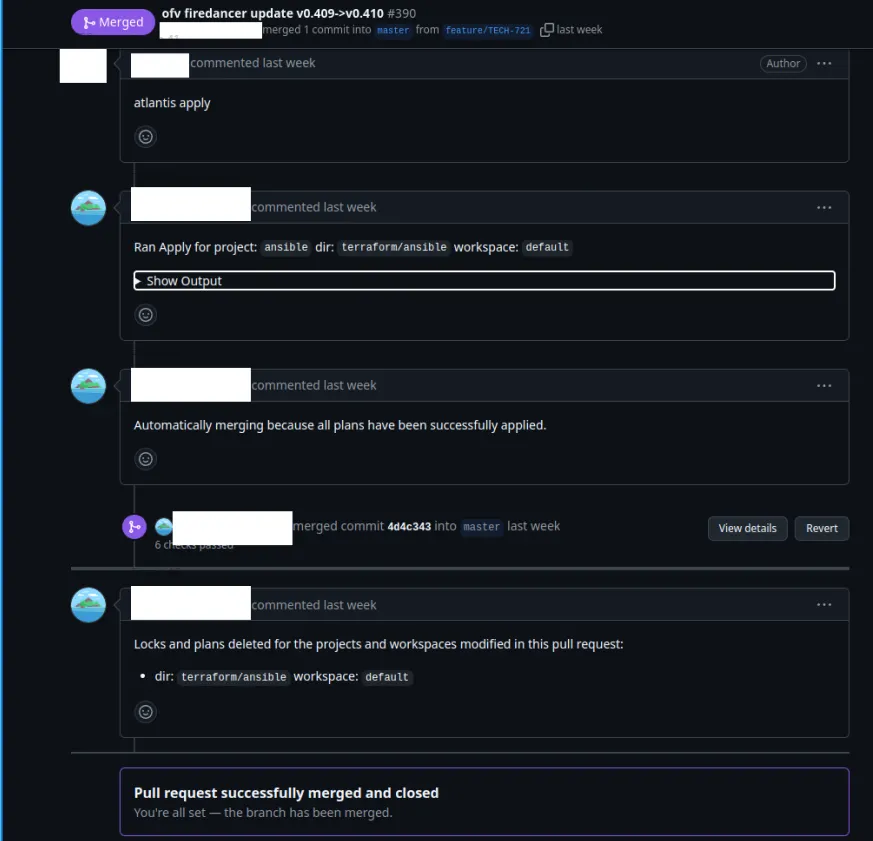
The PR is automatically merged on a successful deploy.
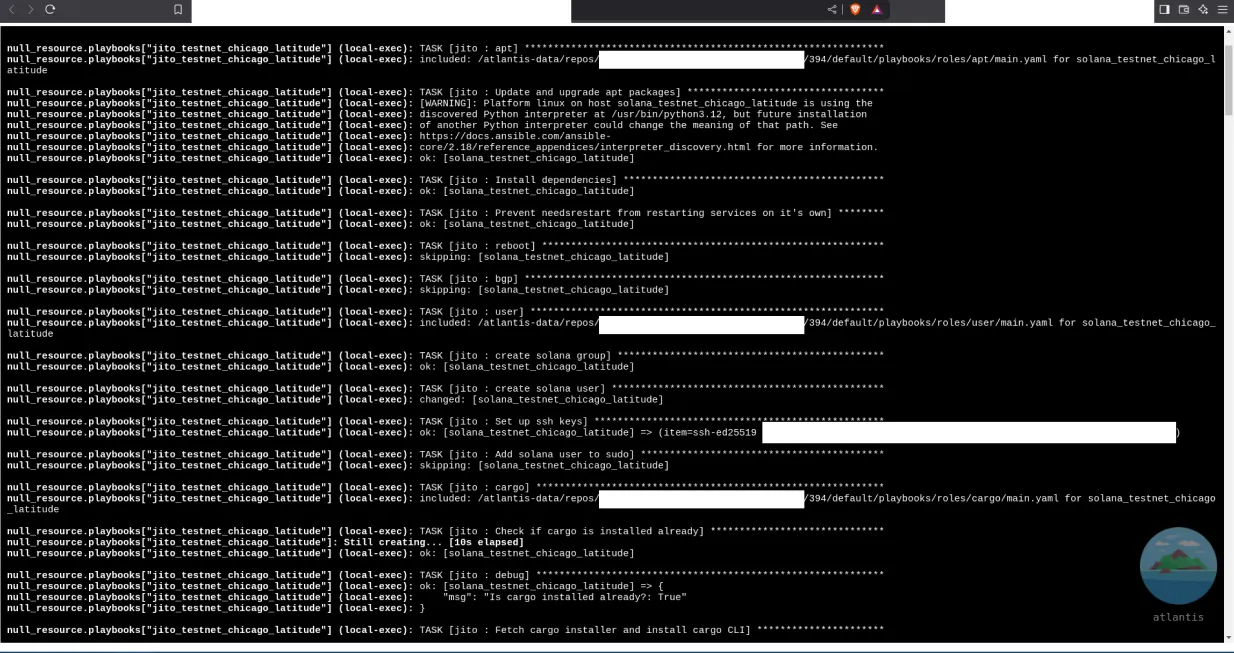
An example pipeline is below (although much longer than able to show in a screenshot), and from start to finish, we are able to deploy a new validator and / or upgrade one in ~8 minutes!

Upgrading a Validator
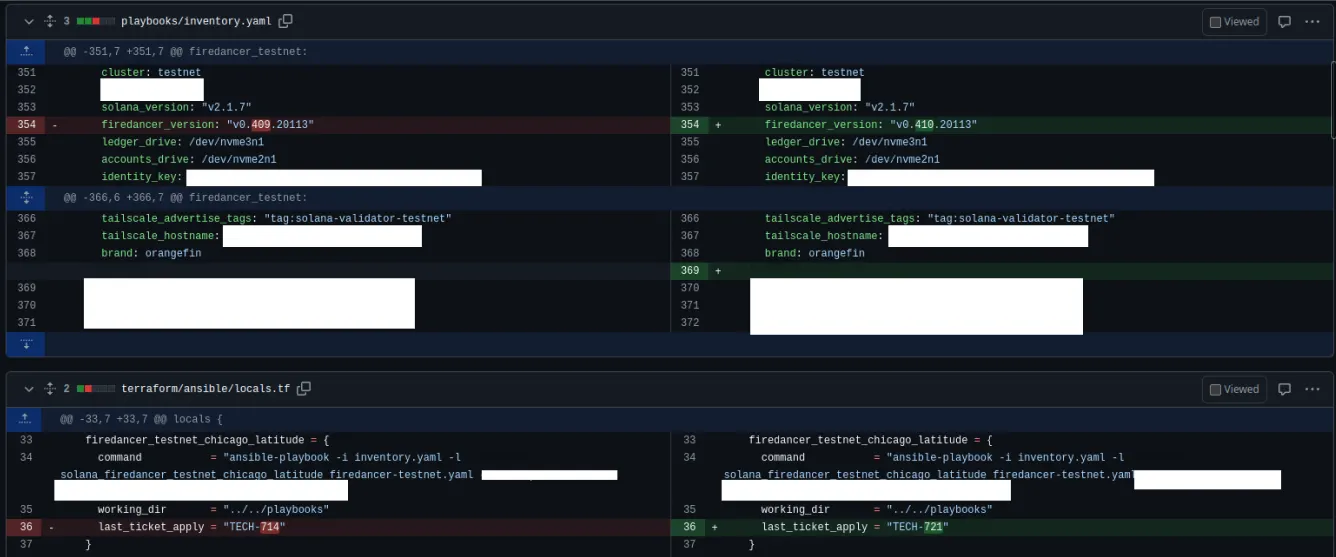
Because of our automation, a version upgrade is simply a 2 line code change.
- Upgrading the version in inventory
- Tying the deployment to a change ticket, required for audits such as ISO 27001 and SOC 2.
Using Terraform and Ansible Together
For the astute DevOps engineers reading this post, you might have noticed that we combine both Terraform and Ansible together, which can be viewed as an interesting choice.
The way this works is we run a slightly modified container of atlantis that also includes ansible-playbook . Then we simply use the local-exec provisioner to run ansible-playbook inside Atlantis.
The reasons for this are really:
- We use Terraform for everything else besides Solana validators. We already had a quite robust Atlantis set up with a ton of security monitoring around it.
- We did not want to deploy a separate CI/CD system just for Ansible.
- The GitOps workflow of Atlantis suits our needs quite well.
In the future, this might be revisited, as well as even using Ansible in general! But for now, this works great for our needs.
Monitoring and Alerting
We leverage several tools to monitor our validators.
These are:
- Grafana
- Node Exporter
- Solana Watchtower
- Pagerduty
- Custom built Prometheus exporters
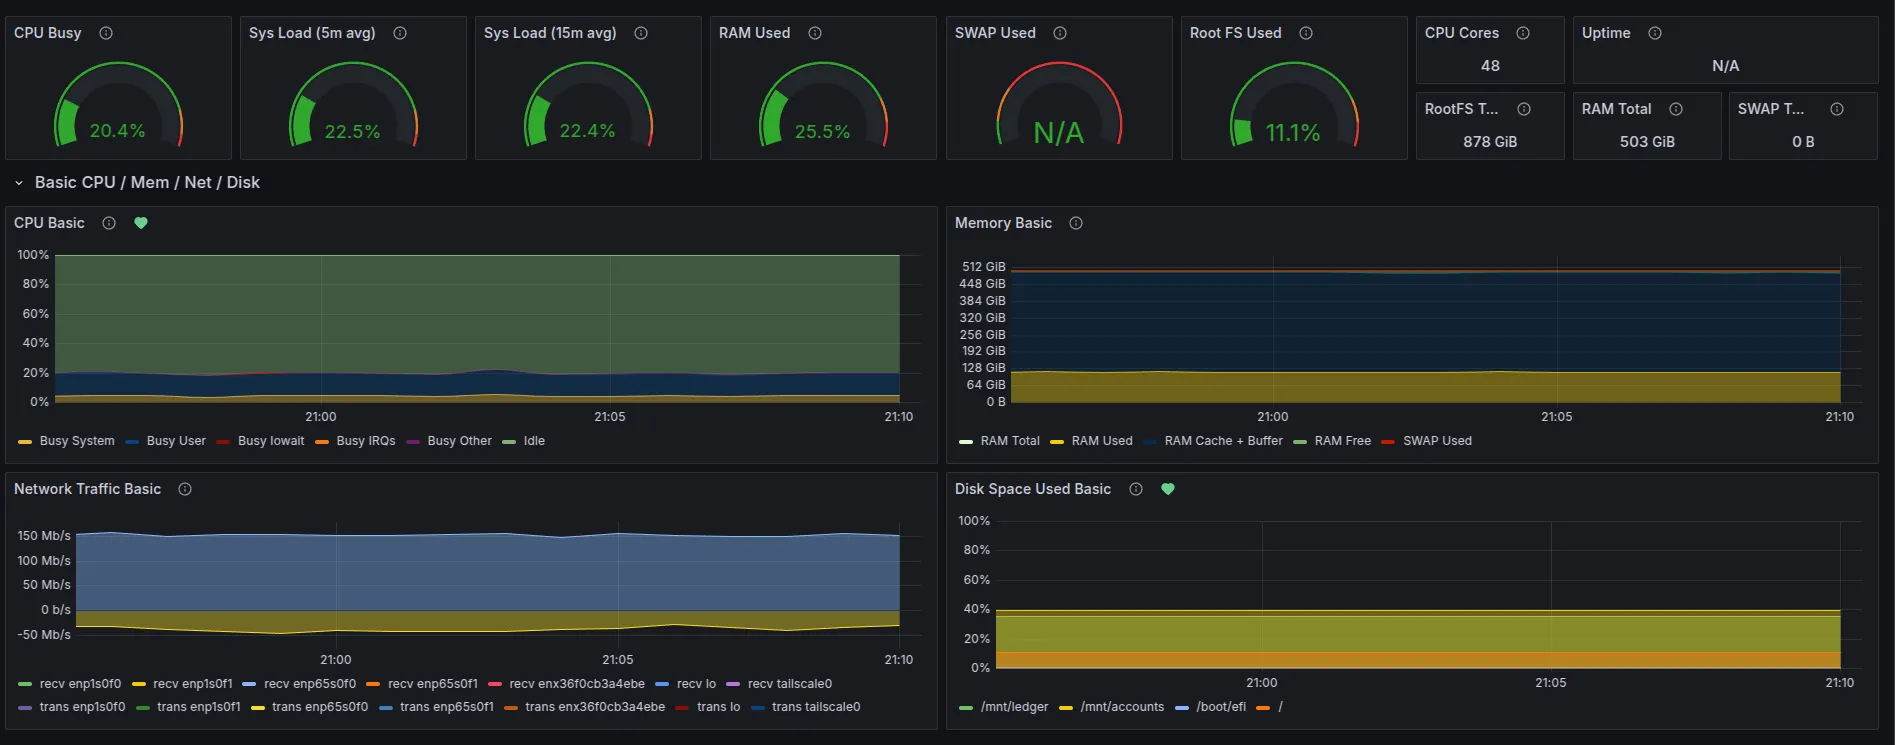
Each validator server runs Node Exporter with dashboards in Grafana. These dashboards themselves have alerts tied to them such as Disk Space Used Basic which you can see by the green heart in the picture above.
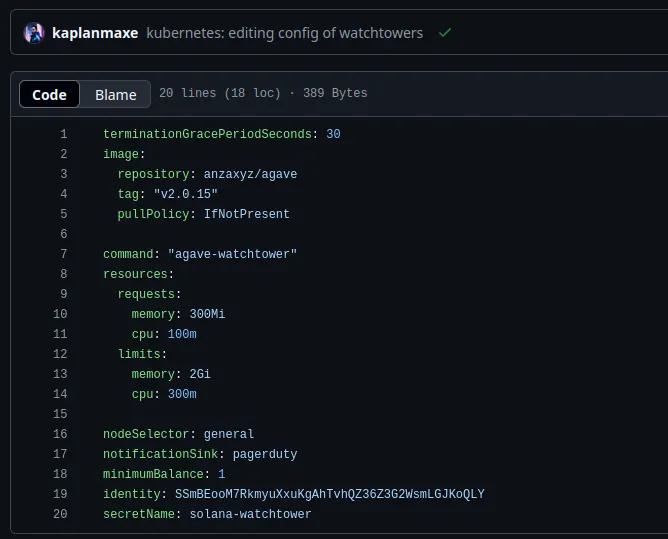
Additionally, we also run Solana Watchtower tied to PagerDuty. We run a watchtower for each validator. These watchtowers run inside kubernetes off of the validator server intentionally, so that in the event a validator server goes down, we will still get alerted.
Like everything else, we have all of our watchtowers defined as IaaC where we have a custom helm chart to run solana watchtower. A new watchtower can be added in the matter of minutes by mostly copying and pasting and then having atlantis apply!
In the event of an incident, we have 4 engineers on call, 2 in the US, and 2 in APAC.
Additionally, we also have custom, in house built Prometheus exporters. One of them powers https://insights.orangefin.ventures/solana which is available to the public!
Security
While we don’t want to go into all the details of our stack, we do several things to secure our environment.
- SSO: We run a large SSO environment. Access to infrastructure providers is behind SSO with full monitoring and logging.
- SSH: While our kubernetes nodes don’t even have SSH enabled, for machines that do, we go above and beyond just typical SSH access. To access any machine also requires a successful login to our SSO system, where 2fa is required.
- VPN: Every piece of infrastructure is behind our VPN. There is no public access allowed.
- Logging: We run a very robust monitoring and logging system for security alerts.
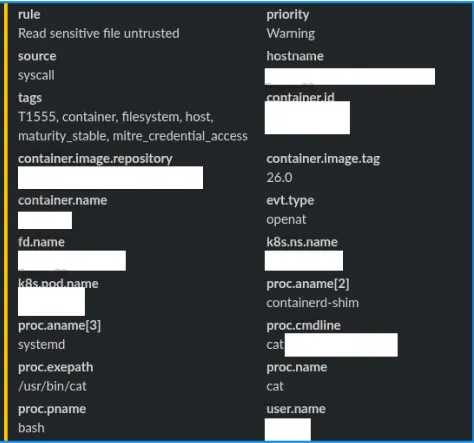
Additionally, one cornerstone of our security set up is eBPF alerts. For sensitive files, we are able to detect when any process reads a file on our machines. Alerts are managed as well as IaaC, deployed via CI/CD.
Summary
By leveraging IaaC (Infrastructure as Code) and automation, we can significantly automate our operations while also maintaining the highest levels of uptime, security, and repeatability.